The Broader Implications
Extreme-weather events create highly localised failures: one street can be plunged into darkness while the next remains lit. For families at home and local business operating, every minute without power matters. Yet network operators can often rely on field reports, customer calls and back-office data that can arrive hours after the first lights go out.
By adding a geospatial lift to the existing meter fleet, EDMI shrank detection time to a single 15-minute window, delivered live evidence of recovery instead of guesswork, and flagged persistent dark pockets where quick action will most help the communities we all serve the most.
Early results were compelling: the pilot showed how real-time location insight can surface the hardest-hit areas minutes after impact, giving operators a crucial head start on restoring power - helping families feel safe sooner and getting local businesses back on their feet faster.


The Challenge and the Benefit
When a severe cyclone swept across Australia’s south-eastern seaboard, EDMI in partnership with Yurika wanted to see which communities were losing power, and how quickly they were recovering. By enriching a targeted subset of the utility’s existing smart-meter fleet with precise latitude-and-longitude co-ordinates, EDMI transformed routine telemetry into a live outage map.
In the pilot we refreshed the view every 15 minutes, but the same pipeline can be dialled down to one-minute granularity where required. What had been static data became a storm-ready radar, accelerating restoration decisions and revealing longer-term investment priorities.
The EDMI Solution
Our approach required no new field hardware, only smarter use of assets already in place.

Impact at a Glance
Faster Detection & Response. Outages detected in ~15 minutes, with crew dispatches prioritised down to suburb-levels and even individual buildings
Persistent outage pockets flagged for deeper asset-health checks and capital planning for the grid
Faster family & business recovery - earlier visibility shaves restoration time, helping households feel safe sooner and storefronts reopen faster.
Looking to the Future
With the geospatial data stream now established, additional use cases are already in sight. By fusing location information with high-resolution meter interval data, EDMI could surface safety-critical issues, such as rising neutral faults or elevated source-impedance, at both the individual-meter level and as hotspot clusters on a network map.
The same framework could feed load-balancing analytics, or even customer-facing outage dashboards, turning today’s storm-response pilot into a platform for grid-wide insight.
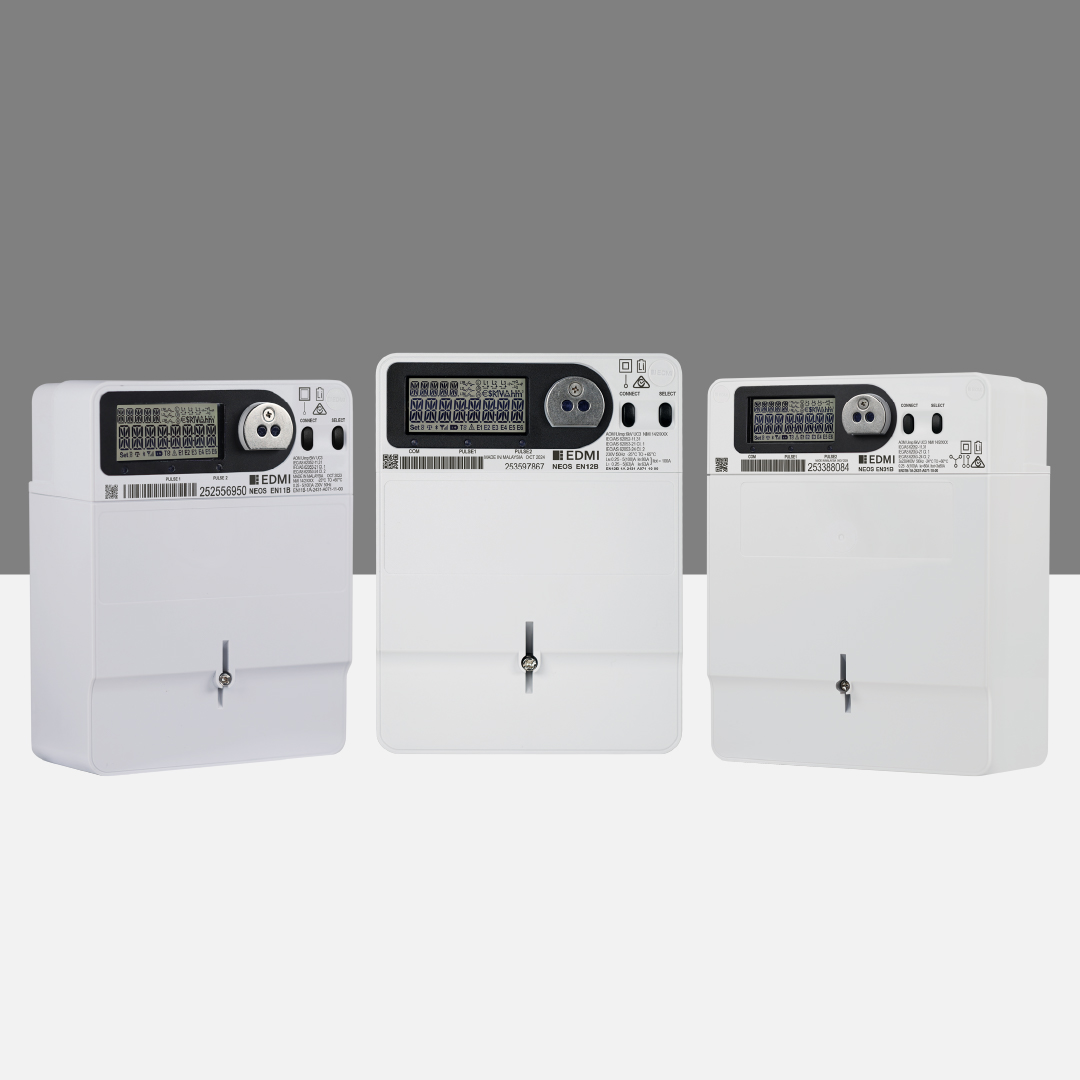
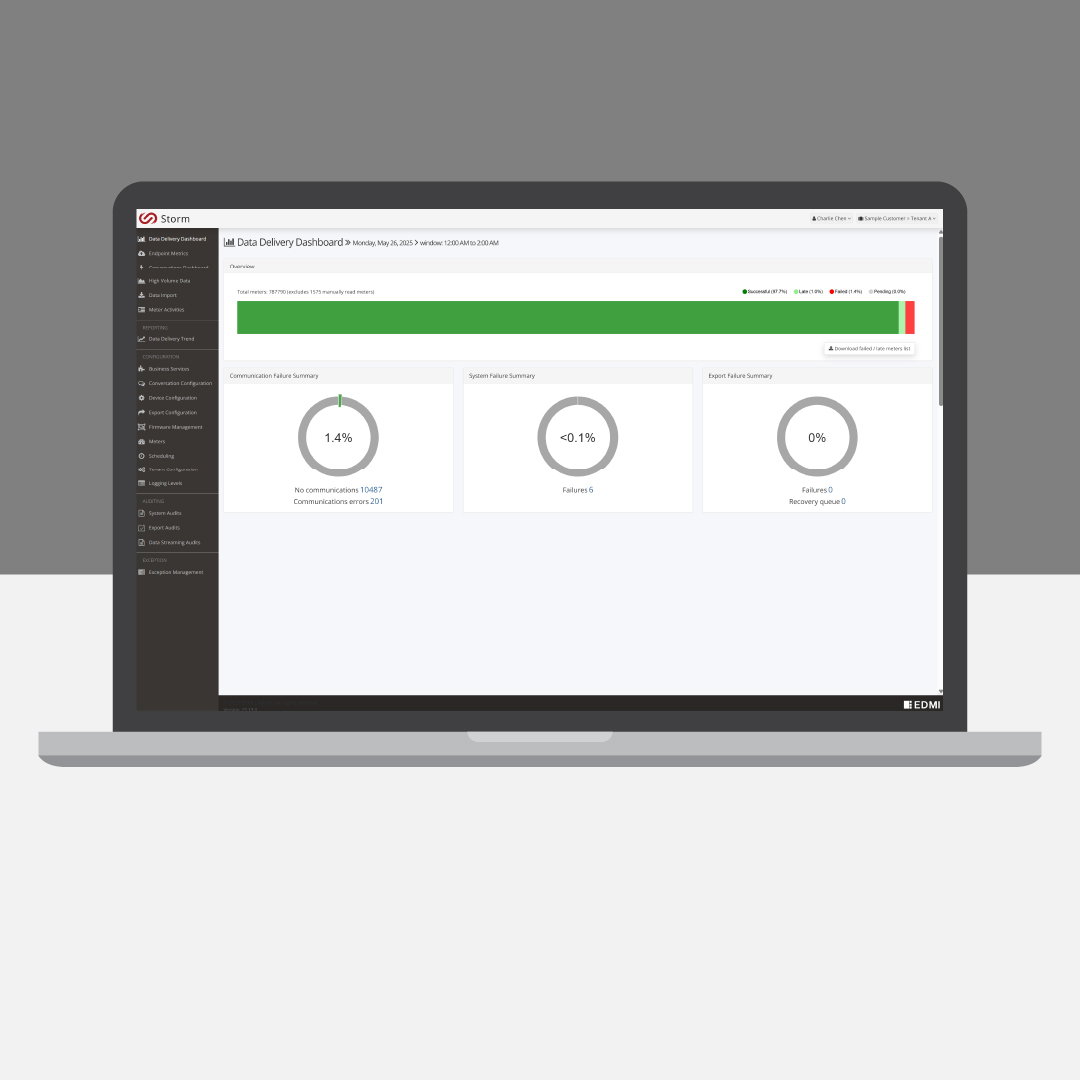
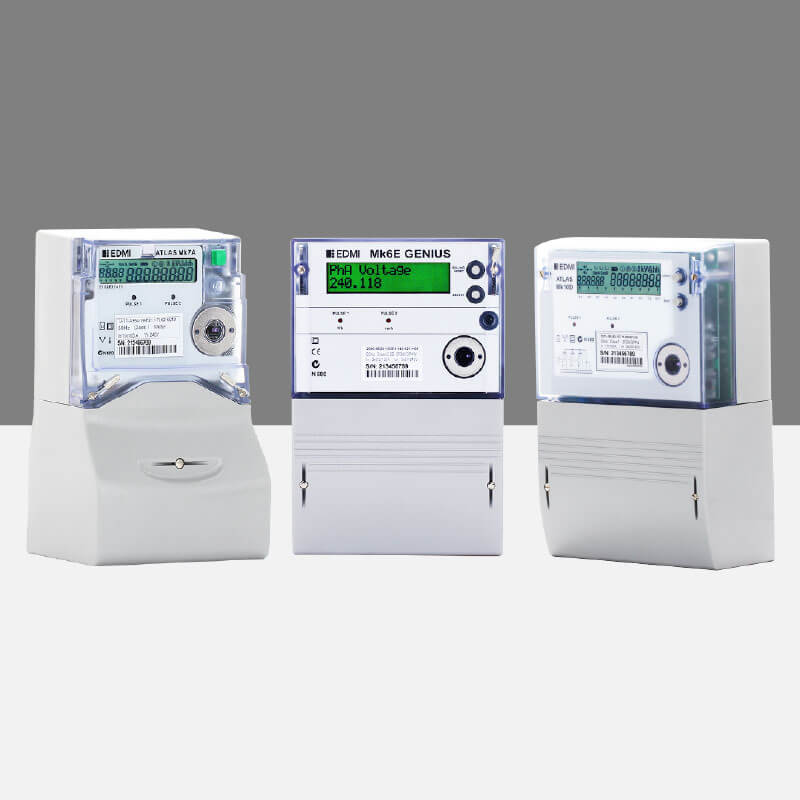
Explore Related EDMI Product Lines
Let’s Build the Future of Energy Together
Whether you're a utility, government agency, or technology partner, EDMI is ready to collaborate on future-ready solutions.